Temperature Logger
The temperature and humidity of our house is something that’s been bothering me for a while. We’re very frugal with the heating and I wanted to know how much difference installing additional insulation in the loft owuld make.
Temperature loggers are available, but they are generally quite expensive, and you really need more than one to know whether your insulation’s making a difference (since you really need to know the temperature differential between the house and the loft to be able to calculate whether the rate of loss has changed). After a bit of research, I discovered that temperature sensors with a digital output are available for a couple of pounds on eBay (search DHT11 or DHT22). The DHT11 are 1degree C resolution, the DHT22s are 0.1degree, but otherwise they’re essentially identical.
I’ve made a temperature logger that uses an Arduino, short-range radio tranceivers and logs to a text-file on my Raspberry Pi, via the radio link.
What’s involved
There are several components in this system, so it needs a bit of explanation. First, the Arduino is connected to the temperature sensors and radio transceiver. Secondly, the Raspberry Pi is connected to the radio transceiver and has a little bit of C++ code running to do the data reception. This code is then run by supervisord which logs it to a text file in the user directory on the Pi.
 %}
%}
Arduino
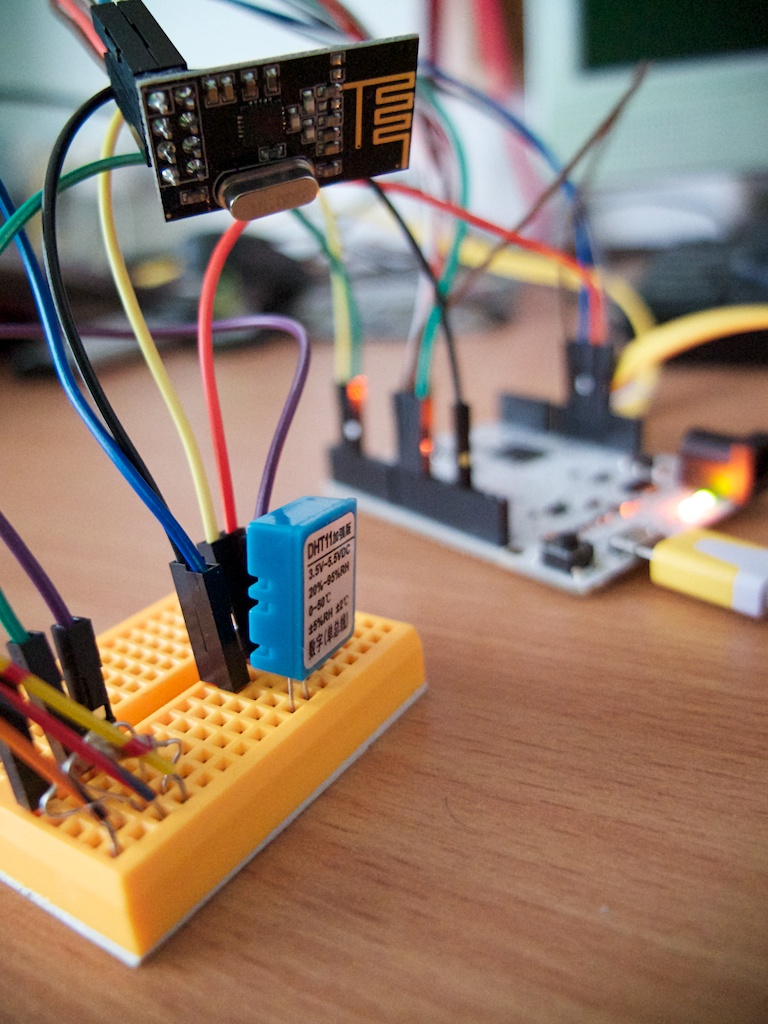
Two DHT11 temperature sensors are connected to the Arduino. I used the DHT11 library from Adafruit to connect to the sensors. The sensors need three connections: +5VDC, Ground, and a data connection. You need to connect a pull-up between the data pin and +5VDC.
For the radios, I used nRF24LO1+ transceivers, which are all over eBay (and Sparkfun, Adafruit et.al.) for not much money. I paid about £1.20 including shipping from China. The radios communicate via SPI (plus a couple of other pins for state information), and are relatively easy to get working. I used maniacbug’s RF24 library from GitHub. I won’t go into too much detail about how I got this working since I would just be recycling the great work of others, but you can find information on Maniacbug’s website, along with many other places.
One thing that caught me out intially is that you need two radios connected and working (doesn’t matter whether they’re connected to a Raspberry Pi, Arduino or whatever) before the example code will tell you that it’s working. This is because the radios handle all of the networking layer communications and will report that a tranmission was unsuccessful unless they receive a response from another device. Another gotcha is that both radios need to be configured to use the same radio channel and pipe-settings (the RPi examples don’t seem to work out of the box for me – I had to modify them to match the Arduino stuff).
The complete Arduino sketch is shown: //Temperature Sensor Telemetry //Written by Tim Stephens 30 October 2013 //Public Domain
//Based on RF24 examples by Maniacbug, and DHT11 examples by Ladyada.

#include <SPI.h>
#include <RF24.h>
#include "DHT.h"


// ce,csn pins
RF24 radio(9,10);


//Temp Sensors
DHT sens1(2, DHT11);  //in house
DHT sens2(3, DHT11);  //in loft


void setup(void)
{
    // init radio for writing on channel 76
    radio.begin();
    radio.setPALevel(RF24_PA_MAX);
    radio.setChannel(0x4c);
    radio.openWritingPipe(0xF0F0F0F0E1LL);
    radio.enableDynamicPayloads();
    radio.powerUp();

    sens1.begin();
    sens2.begin();

    Serial.begin(9600);

}

void loop(void)
{
    // 32 bytes is maximum payload
    char outBuffer[32]= "";
    char floatBuf1[10];
    char floatBuf2[10];
    float h, t;
    h = sens1.readHumidity();
    t = sens1.readTemperature();

    dtostrf(h, 6, 2, floatBuf1);  //Floats don't work in sprintf statements on Arduino without pain, so convert to string separately.
    dtostrf(t, 6, 2, floatBuf2);
    // write string
    sprintf(outBuffer,"S1 T%s H%s", floatBuf2, floatBuf1 );

    // transmit the buffer
    radio.write(outBuffer, strlen(outBuffer));
     // pause a second
     delay(1000);

     //Output to the serial port on the Arduino so that we can connect to it to check that it's all behaving properly.
      Serial.print(floatBuf1);
      Serial.print("Humidity: ");
      Serial.print(h);
      Serial.print(" %\t");
      Serial.print("Temperature: ");
      Serial.print(t);
      Serial.println(" *C");


    delay(1000);


  //Same again for the second sensor (yes, I know it's not pretty coding and that I should probably use a function or something for this!)
     h = sens2.readHumidity();
     t = sens2.readTemperature();

    // pad numbers and convert to string
        dtostrf(h, 6, 2, floatBuf1);
    dtostrf(t, 6, 2, floatBuf2);
    // write string
    sprintf(outBuffer,"S2 T%s H%s", floatBuf2, floatBuf1 );
    radio.write(outBuffer, strlen(outBuffer));
    delay(1000);
    // pause a second
    Serial.print(outBuffer);
     Serial.print("Humidity2: ");
      Serial.print(h);
      Serial.print(" %\t");
      Serial.print("Temperature2: ");
      Serial.print(t);
      Serial.println(" *C");
    delay(1000);


}
The Arduino code simply reads the temperature from the sensors and broadcasts it with the radio every few seconds. There’s nothing more to it than that! A later version (i.e. when I eventually get an SD card reader and an RTC will enable logging to an SD card from the Arduino and proper time-stamping of the data; I’ll also be able to sleep the Arduino and make it up every minute or two to make a measurement rather than spinning the timer and chewing power).
Raspberry Pi
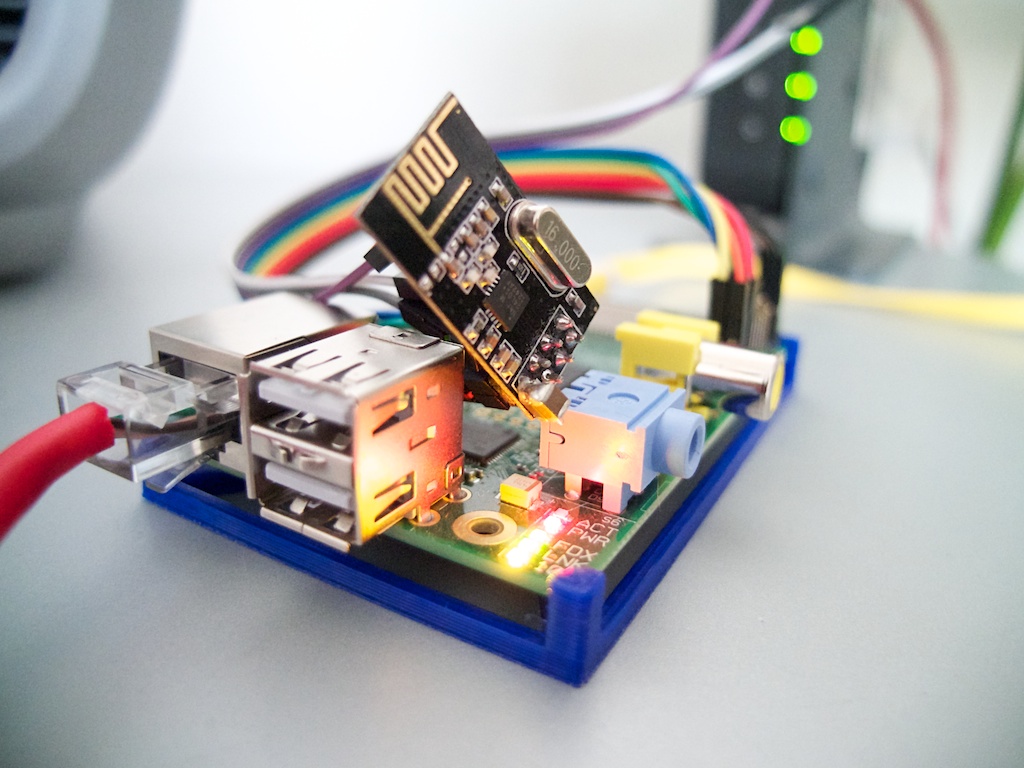
To receive the broadcast data from the Arduino sensor, I connected one of the radios to my Raspberry Pi, which in turn is connected to the hose router (internet-of-things coming soon hopefully!). The Raspberry Pi code also uses the RF24 library, and is a short bit of code written in c++. I based this code on some that I found on the internet, and modified it to output the data with a timestamp.
#include <cstdlib>
#include <iostream>
#include "../RF24.h"
#include <time.h>


using namespace std;

// spi device, spi speed, ce gpio pin
RF24 radio("/dev/spidev0.0",8000000,25);

void setup(void)
{
    // init radio for reading
    radio.begin();
    radio.enableDynamicPayloads();
    radio.setAutoAck(1);
    radio.setRetries(15,15);
    radio.setDataRate(RF24_1MBPS);
    radio.setPALevel(RF24_PA_MAX);
    radio.setChannel(76);
    radio.setCRCLength(RF24_CRC_16);
    radio.openReadingPipe(1,0xF0F0F0F0E1LL);
    radio.startListening();
}

void loop(void)
{
    // 32 byte character array is max payload
    char receivePayload[32];
    time_t t = time(0);   // get time now
    struct tm * now = localtime( & t ); // Get curret Time.

    while (radio.available())
    {
		 // read from radio until payload size is reached
		uint8_t len = radio.getDynamicPayloadSize();
		radio.read(receivePayload, len);

		// display payload
		cout << (now->tm_year + 1900) << '-'
		<< (now->tm_mon + 1) << '-'
		<<  now->tm_mday << ' '
		<< now->tm_hour << ':'
		<< now->tm_min << ' '
		<< receivePayload << endl;
	}
}

int main(int argc, char** argv)
{
    setup();
    while(1)
        loop();

    return 0;
}
The code is then compiled using the command:
g++ -Wall -Ofast -mfpu=vfp -mfloat-abi=hard -march=armv6zk -mtune=arm1176jzf-s -L../librf24/ -lrf24 thingspeak.cpp -o thingspeak
When the code is run (you need to use sudo since access to the SPI ports on /dev/spi0 is restricted to the superuser), any data that’s broadcast from the Arduino is printed to stdout with a timestamp.
To log the data to a file, I used a utility called supervisord, which makes it easy to start services automatically. There’s lots of information on the supervisord website.
Results
After a few days, the temperature log file grew to approximately 4MB with measurements being taken every 5 seconds or so (which is far more time resolution than is required for this application). I wrote a Python1 script to read in the data and produce a nice graph.
#!/usr/bin/python

from pylab import *
import datetime

#Have a couple of arrays to contain the temp/humidity data for each sensor location.
dt1 = [];
dt2 = [];
temp1 = [];
temp2 = [];
hum1 = [];
hum2 = [];


inFileName = "/Users/timini/TempLog"
"""
# Read in line and parse for data
# The items in the returned list are:
Date
Time
Sensor ID
T delimiter
Temperature
H delimiter
Humidity
"""
#['2013-11-23', '12:59', 'S1', 'T', '18.00', 'H', '47.00\n']

inFile = open(inFileName)

while True:
	tempdata = inFile.readline()

	#Read until the end of the file.
	if tempdata == "":
		break
	tempdata = tempdata[:-1] #remove the /n from the end of the file.
	tempdata = tempdata.replace("  ", " ") #There are sometimes two spaces in the input file because of the way that I converted the values to a string for transmission.
	tempdata = tempdata.replace(" NAN", "0.00") #Parse out the lines where the sensor wasn't connected.
	outdata = tempdata.split(" ")

	try:
		dt = (datetime.datetime.strptime(outdata[0] +' '+ outdata[1], "%Y-%m-%d %H:%M"))
	except (ValueError):
		dt = (datetime.datetime.strptime(outdata[0] +' '+ outdata[1], "%Y-%m-%d %H:%M:%S"))
	#else:
	#	print "Error parsing date format - format not found"
	#	print outdata[0] + ' ' + outdata[1]
	#	#raise

	#date.append(outdata[1])
	#time.append(outdata[2])

	if outdata[2] == "S1":
		#Data is for sensor 1
		temp1.append(float(outdata[4]))
		hum1.append(float(outdata[6]))
		dt1.append(dt)

	elif outdata[2] == 'S2':
		#Data is for sensor 2

		temp2.append(float(outdata[4]))
		hum2.append(float(outdata[6]))
		dt2.append(dt)
	else:
		#Error!
		print "Error parsing sensor identifer"
		break

#End while

print 'date '
print len(dt1)

print 'temp1 '
print len(temp1)

inFile.close()

days = DayLocator(bymonthday=range(1,32))
daysFmt = DateFormatter("%d/%m/%y, %H:%M")
hours = DateFormatter("%H")

fig = plt.figure()
ax1 = fig.add_subplot(211)
ax2 = fig.add_subplot(212)

dates = matplotlib.dates.date2num(dt1)
ax2.plot_date(dates, temp1)
ax2.xaxis.set_major_locator(days)
ax2.xaxis.set_major_formatter(daysFmt)
ax2.xaxis.set_minor_formatter(hours)


ax2.autoscale_view()
#ax.xaxis.grid(False, 'major')
ax2.xaxis.grid(True, 'minor')
ax2.grid(True)

ax2.set_title("House Temperature")
ax2.set_xlabel("Date, Time")
ax2.set_ylabel("Temperature/C")

ax1.plot_date(dates, temp2)
ax1.xaxis.set_major_locator(days)
ax1.xaxis.set_major_formatter(daysFmt)
ax1.xaxis.set_minor_formatter(hours)
ax1.set_title("Loft Temperature")

ax1.autoscale_view()
ax1.xaxis.grid(True, 'minor')
ax1.grid(True)

plt.show()
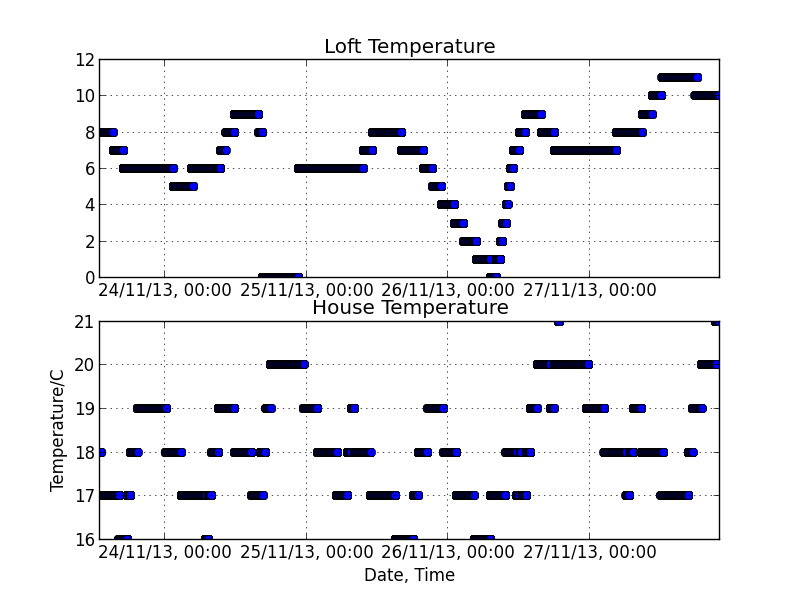
The temperature is in 1degree steps because my sensors only have that resolution. the DHT22 sensors offer 0.1degree resolution and are the preferred solution where a better measurement of the temperature is required.
-
Why Python? Well, the latest installation of OS X Mavericks has broken the MacPorts version of Octave, and I don’t know enough about that stuff to fix it. In the meantime, it seemed like a good excuse to learn another new language. ↩